
Table of Contents
- Introduction
- Know what a Gantt Chart is?
- Importance of Gantt Charts
- Know what a Timeline view is?
- Importance of Timeline view
- Gantt Chart vs Timeline
- Get to know the difference between Gantt Charts and Timelines
- Gantt Charts for Project Planning
- Timeline View for project presentation
- Applying the Gantt Chart to your team’s tasks and progress
- Best way to use them all for your project?
- You can create Gantt charts and timelines in an online tool like ProofHub.
- Why use the Gantt chart view in ProofHub?
- How to create a Gantt Chart in ProofHub
- Conclusion
Introduction
You’ve probably heard the terms “Gantt chart” and “timeline” tossed around quite a bit. Businesses use them to plan out projects and tasks, while people use them to plot out personal goals. But what are these charts actually used for? And how do you create one, anyway? This guide will answer those questions and more so that you can use Gantt charts and timelines in your business or day-to-day life.
Know what a Gantt Chart is?
A Gantt chart is a graphical representation of a project schedule, which shows the start and end dates of tasks, their duration, and the dependencies between them. The horizontal axis represents time across one or more projects. The vertical axis represents the activity of each project. Usually, you’ll see a time span listed at the bottom of your Gantt chart so you know exactly how long it took to complete each task and when they started/ended in relation to other tasks.
If you want to see your progress over time, Try out ProofHub today!
Importance of Gantt Charts
Gantt charts are a great tool for project managers and their teams to visualize their projects. They help project managers see where they are at and where they are going in the future, which is essential for any successful team.
They’re also helpful when you want to get a quick overview of what needs to be done, who is doing it, and when.
If you need to see the status of multiple projects or teams at once, then Gantt charts will be very useful.
This is particularly important if one part of your project relies on another part being completed first (this could be because resources are shared between projects).
For example: if Team A needs input from Team B before they can start work, then using a Gantt chart will help you see how long this will take. This means that if there’s an issue with getting this information from Team B by an agreed date then it won’t affect all other activities across your organization negatively like it would if they were all trying to do everything independently.”
Know what a Timeline view is?
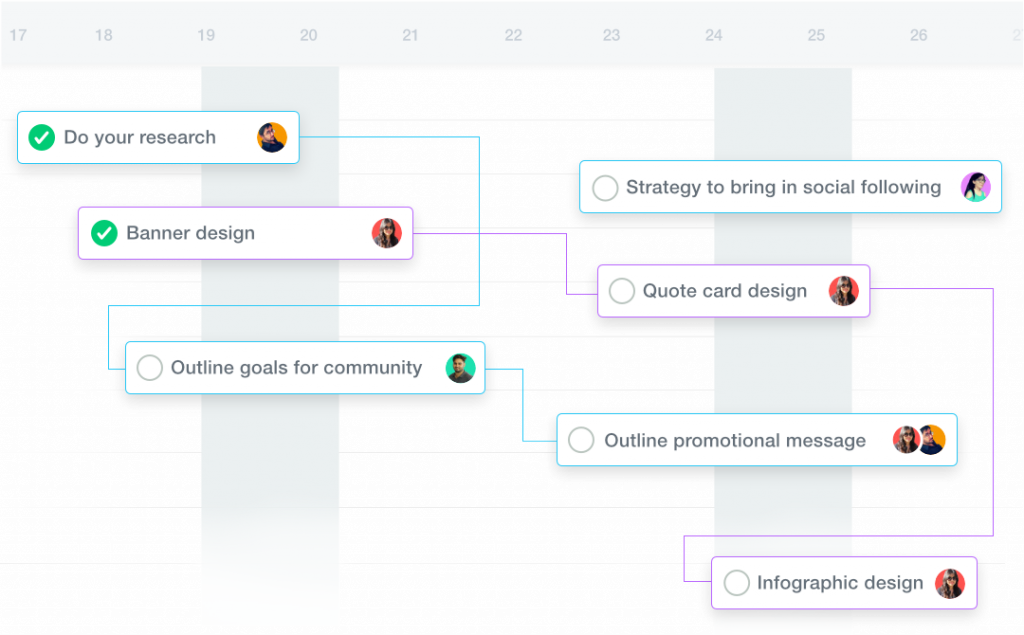
You may have heard the term “timeline view” before, but what is it? A timeline view is a visual representation of a project—including all of its tasks and deadlines. Timelines are useful for keeping track of how far along in a project you are, as well as when each task should be completed. They can help you plan out your workload, or even show off your progress to clients or coworkers!
Importance of Timeline view
The Timeline view is a visualization of your project schedule. It can be used to:
- Communicate the schedule to team members in order to get them excited about working on it, and keep them informed about where they are in relation to that schedule as they work on it.
- Communicate the schedule to stakeholders (such as clients or bosses) so that they can see how things are going when tasks will be completed, and what needs to happen next.
- Communicate the final outcome of your project—namely, when it’s going live—to everyone involved (this includes yourself!).
For example, if you’re working on a website redesign for a client whose deadline is coming up soon but who hasn’t yet seen any designs from you or discussed what kind of changes might be made during development stages later on down the line (because maybe she’s been busy?), then showing her these timelines at each stage could help reassure her that everything is still progressing smoothly toward completion despite not having talked much lately.
Gantt Chart vs Timeline
Get to know the difference between Gantt Charts and Timelines
Gantt charts are used to plan and manage projects, while timelines show the start and finish dates of tasks.
- Gantt charts are used to show the start and finish dates of tasks.
- Timelines are used to present projects, which include multiple tasks, events, or 2 milestones.
Gantt Charts for Project Planning
A Gantt chart is a type of network diagram that shows the project phases and tasks in a timeline format. The name comes from its creator, Henry L. Gantt, who developed this method of planning projects during his time as an engineer at the Pullman Company in Chicago in 1910. In fact, many modern project management software tools still use Gantt charts to help users visualize their plans from start to finish.
A typical Gantt chart has three columns: one for each phase of your project or task (e.g., Design, Development, and Testing) with rows representing all of your tasks for that phase (e.g., creating UX wireframes).
You can also have multiple columns if you’re working on multiple projects at once!
Timeline View for project presentation
The timeline view is ideal for presenting a project plan to stakeholders. It’s easy to create and share, easy to understand, and easy to update. The timeline format allows you to add tasks, subtasks, and milestones easily. You can also assign resources and link them with task dependencies.
Applying the Gantt Chart to your team’s tasks and progress
So, you’ve got the basics down. You know how to create a Gantt chart and how it can help you manage tasks and progress. But what about when you actually implement it with your team? How do you go about applying this valuable tool to your own project?
The first step is to brainstorm ideas for projects that could benefit from a Gantt Chart, as well as any roadblocks or red flags that might arise during or after implementation. Then, once you’ve identified which projects need organizing, create a list of all of the tasks involved in each project (make sure not to skip any details). Once those are recorded on paper, sketch out an outline of each task and its expected duration—this will become your timeline!
Next comes one of the most important steps: figuring out where each team member fits into this picture. When creating timelines like this one, I recommend dividing up responsibilities based on skill sets rather than time spent working side by side every day (which may not be possible depending on who works remotely). This way each person gets equal responsibility without spending too much time trying their hardest only at certain times throughout their day/weekend/month/etcetera while others get stuck doing more menial tasks but less fun ones instead (because let’s face it: no one wants those jobs!).
This system allows everyone to get an equal share of work done without feeling left out or overwhelmed with extra work because not everyone needs help finishing their job quickly enough before moving onto another piece.”
Best way to use them all for your project?
The best way to use them all?
To help you decide which Gantt Chart or Timeline View is right for your project, let’s take a look at how you can use each one.
- Use the Gantt Chart for planning tasks and features, then link them together in the Timeline View. This way you’ll see exactly how long each task takes and plan accordingly. You can also add events (e.g., meetings or deadlines) on top of your Timeline View for plans that are more fluid than those in a Gantt Chart.
- If you’re presenting your project plan to clients or stakeholders, show them what it will look like using the Timeline View—it provides an easy-to-digest view of tasks grouped by dates (which means no need to read through bulleted lists). And if they have questions about specific parts of the timeline, they can easily click on those days/weeks/months so they know exactly what happened during that time period!
You can create Gantt charts and timelines in an online tool like ProofHub.
Gantt charts and timelines are both visual representations of a project timeline, but they’re used for different purposes. Gantt charts are best suited for tasks that need to be completed in fixed time periods. For example, if you need to build an app that will take one year from start to finish, you could use a Gantt chart to organize all your phases or steps and assign each person who has an assigned task with their own line item on the graph.
Timelines, however, give more flexibility and allow you to highlight significant events like milestones and deadlines separately from smaller steps within the project plan. If you want people who are not involved in all stages of production – say investors or marketing teams – this may be a better way for them to understand how long things take so they have realistic expectations when planning promotional activities around product launches/new releases etc.
Why use the Gantt chart view in ProofHub?
Gantt charts are great for project planning. They help you to stay on track and plan better by giving you an idea of what needs to be done, who will do it, when they need to be done, and how much it will cost.
Gantt charts are great for project presentations. It helps in presenting the status of a project by providing a visual representation of the schedule in the form of bars or rectangles with time codes on them so that everyone knows exactly where he/she stands in terms of completion with respect to others working on similar tasks; this makes it easier for teams to work together as one unit rather than as individuals who may not understand each other’s roles perfectly well even though they might be working on similar tasks themselves.
Gantt charts are great for project management because managers can use this tool effectively when communicating their goals and expectations about projects being completed within certain time frames; by using Gantts, managers can ensure that employees get clear direction regarding objectives without having any miscommunication issues arise later down the line during implementation stages (such as workload distribution). This helps us all know exactly what needs doing now while also helping us identify potential risks early enough so they don’t become big problems later down the road.”
How to create a Gantt Chart in ProofHub
Creating a Gantt Chart in ProofHub is easy.
- Go to your project dashboard and click on the ‘Gantt Chart’ button (you’ll see this at the top of your page).
- Select the project type: Milestone or Task.
- Select a duration for your project—that’s how long it should take to complete, in days or hours.
- Give your project a name and select its start date, end date, start time, and end time.
Conclusion
We hope this article has helped you understand the difference between a Gantt chart and timeline, as well as how you can use them to better track your project’s progress. By now, you should have learned that both of these visual aids are great tools for planning and executing your projects. However, if we had to choose one over the other, it would be none other than the Gantt chart due to its versatility in project management.